
Detailed View
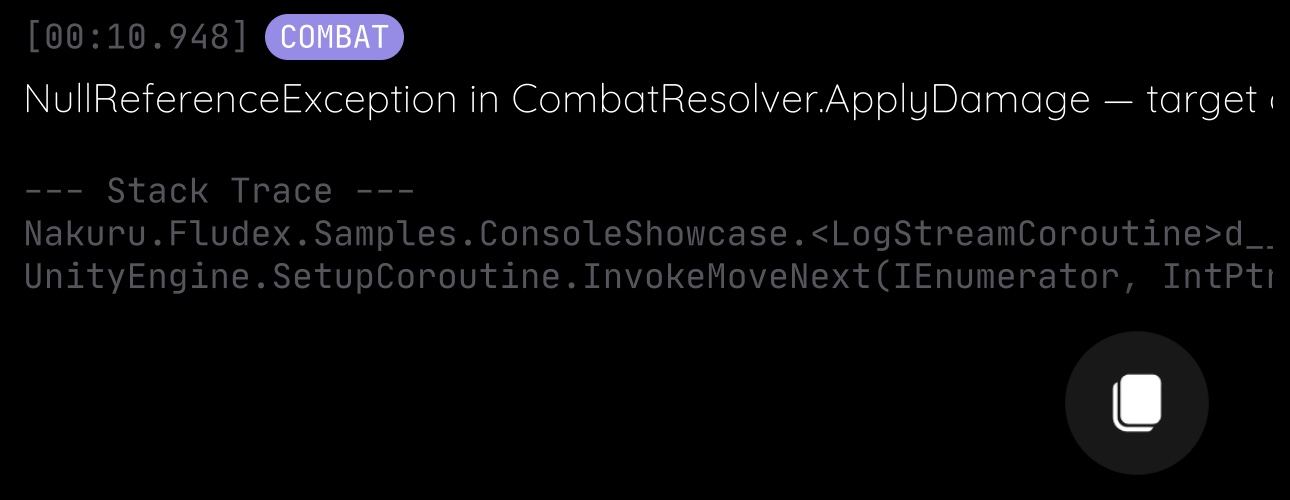
Tap any log row to open the detail pane — a resizable split view along the bottom of the console showing the full message and stack trace, without truncation.
What It Shows
- Full, untruncated message text
- Full stack trace
- Tag chips, matching the list's styling — see Tags
- A timestamp, always visible for the selected log regardless of whether timestamps are shown in the list — see Timestamp below
Resizing
Drag the split handle to resize the pane, up to 70% of the panel height. The ratio you leave it at is remembered and reapplied if the panel itself is resized.
Action Menu
Tap the open detail pane to reveal an action menu with a Copy action — see Sharing for the exact format it copies.
The menu is suppressed if the pane is resized below a small height threshold, to avoid overlapping the content.
Timestamp
The detail pane always shows a timestamp for the selected log, in one of two modes (configurable in settings):
- Game Time (default) — elapsed time since the app started, shown as
[minutes:seconds]or[minutes:seconds.milliseconds](e.g.[04:12]or[04:12.227]); minutes are a plain elapsed count, not clock-wrapped, so long sessions show values like[125:07] - Device Time — wall-clock time the log was received, formatted with the standard
HH:mm:ss/HH:mm:ss.fffpattern (e.g.[14:32:07]or[14:32:07.227])
Milliseconds can be toggled independently of the mode.